
TL;DR
Background
“Churn” refers to the rate at which customers halt their business with a company. This case study focuses on predicting churn in the banking industry using real-world data and enhancing predictions with the Dark Matter algorithm.
Results
We’ve improved the accuracy of churn predictions, reducing unnecessary business decisions for customers who aren’t at risk of leaving.
Background
‘Churn,’ in a business sense refers to the rate at which customers stop doing business with a company or stop using its products or services. It’s a measure of customer attrition and is particularly important in businesses that rely on repeat customers, such as subscription services, telecommunications, or SaaS (Software as a Service) companies.
In this case study, we look to predict churn in the banking industry using real world customer data and then improve upon these predictions by using the Dark Matter algorithm in a machine learning pipeline. The dataset featured in this study includes many typical pieces of information a bank would have about its customers such as the customer’s, credit score, location, gender, and age (more details below).
From a business perspective, predicting customer churn likelihood has numerous applications. Customer retention and experience are paramount, as they directly contribute to revenue growth and positive word-of-mouth. These factors are crucial for maintaining a competitive edge in the market.
Predicting churn is difficult for a number of reasons. There may be outside factors that influence a customer’s decision; some that the company (or bank in this case) has no control over. Imagine showing a song you like to a friend, they may like it or not like it simply because of the mood they are in when they hear it which is something you have no control over!
Because of factors like these, creating accurate churn prediction models requires sophisticated data analysis, advanced machine learning techniques, and a deep understanding of the business and its customers. Even then, predictions are often probabilistic rather than certain.
Dataset

This dataset provides detailed information on bank customers and whether they have left the bank, making it valuable for analyzing the factors that contribute to customer churn in banking. It’s ideal for developing predictive models to identify which customers are likely to leave.
Dataset Features:
- RowNumber: A sequential identifier for each entry in the dataset.
- CustomerId: A unique ID assigned to each customer.
- Surname: The customer’s last name.
- CreditScore: The customer’s credit rating.
- Geography: The customer’s geographical location (e.g., country or region).
- Gender: The customer’s gender.
- Age: The customer’s age.
- Tenure: The number of years the customer has been with the bank.
- Balance: The customer’s account balance.
- NumOfProducts: The number of banking products the customer uses.
- HasCrCard: Indicates if the customer owns a credit card (yes/no).
- IsActiveMember: Shows if the customer is actively using the bank’s services (yes/no).
- EstimatedSalary: The customer’s estimated income.
- Exited: Indicates if the customer has left the bank (yes/no).
Data and Preprocessin
Data Visualization
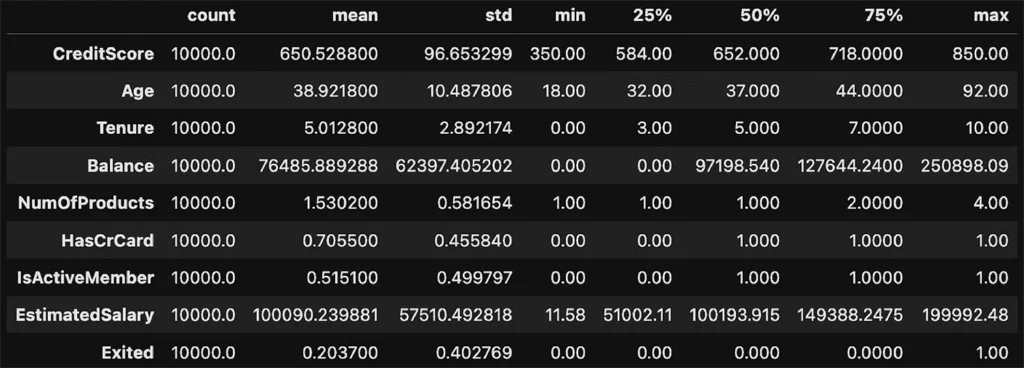
First, we inspect and visualize the dataset. Looking for correlation between the features and the target (Exited ).
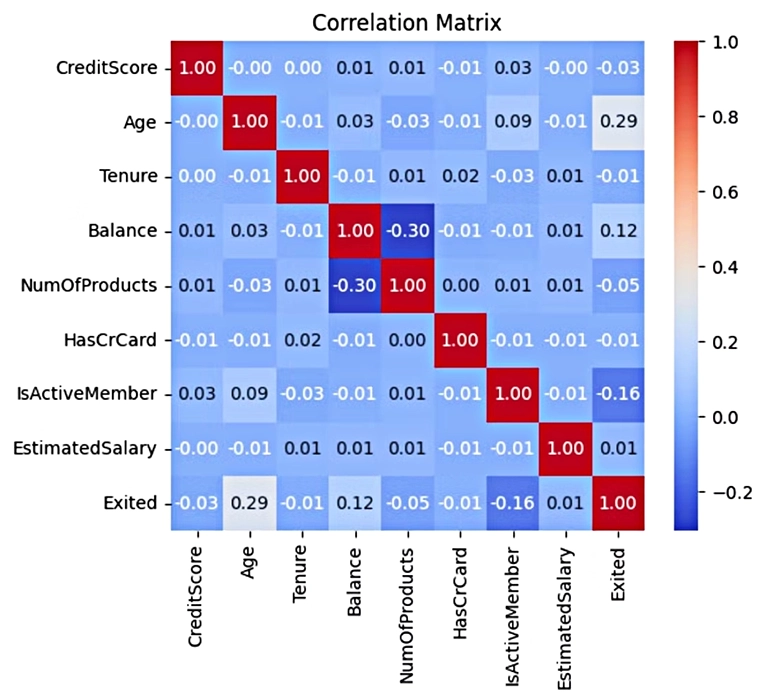
This heatmap provides insights into which features are correlated with each other, such as the positive correlation between Age and Exited (0.29), suggesting that older customers may be more likely to churn.
The heatmap also helps detect potential issues such as multicollinearity (high correlation between independent variables), which could negatively impact model performance. However, in this dataset, no such issues are immediately apparent.
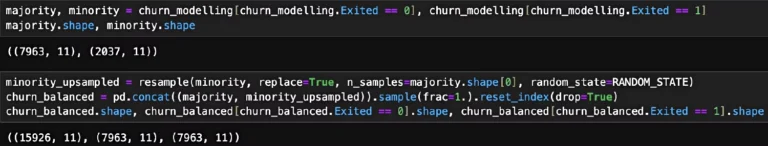
As this is a real-world dataset, we face additional challenges, such as imbalance.
The target classes in this dataset are skewed nearly 4:1 in favor of the non-churn class (label: 0). While this likely reflects real-world conditions, it can inadvertently bias the model to over-predict this class when generalizing to new examples. There are several approaches to address this issue; in this particular case, we simply oversample the minority class to balance it evenly with the majority class.
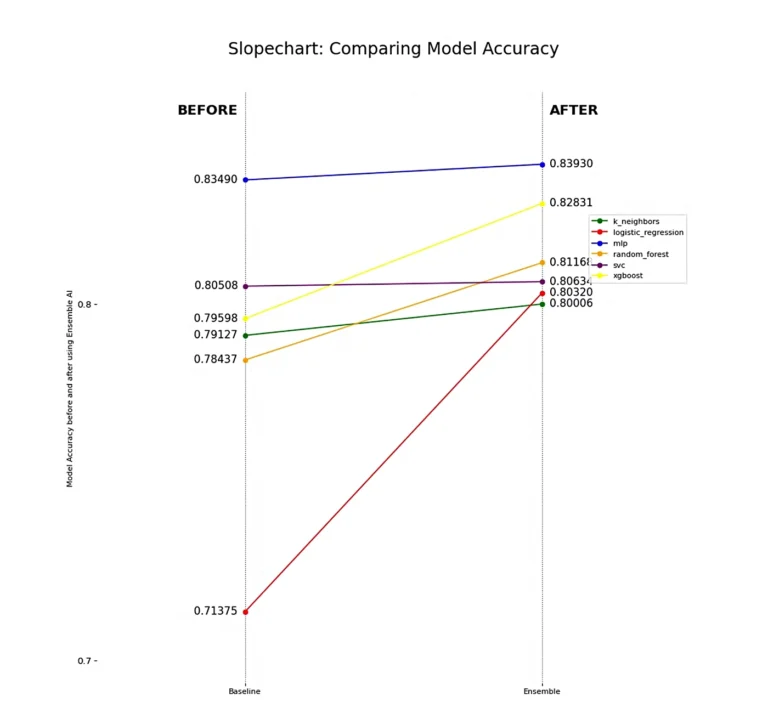
Baseline vs Ensemble
Example of the two pipelines:
Baseline modeling pipeline
→ <11 features> → model → prediction
Ensemble modeling pipeline
→ <11 features> → Dark Matter → <50 features> → model → prediction
Adding Dark Matter to the Pipeline
# With three lines of code, we now have 50 new features to train and validate with

darkmatter = Generator(X_train.shape[1], 1, 50, "classification")
darkmatter = darkmatter.fit(X_train, y_train)
X_train_emb, X_val_emb = darkmatter.generate(X_train), darkmatter.generate(X_val)
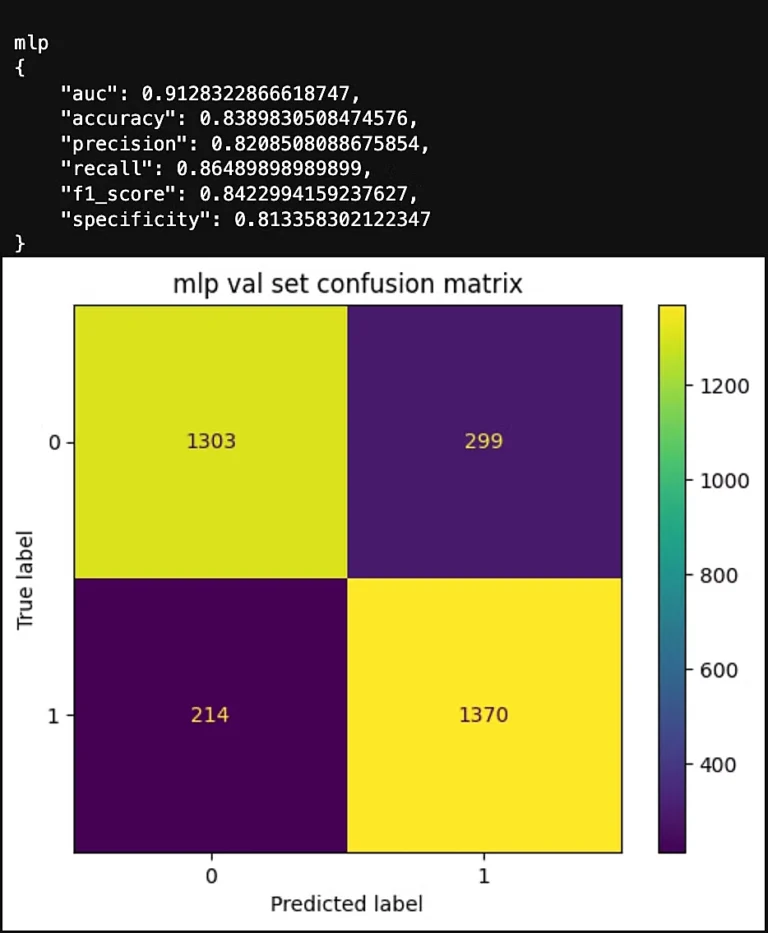
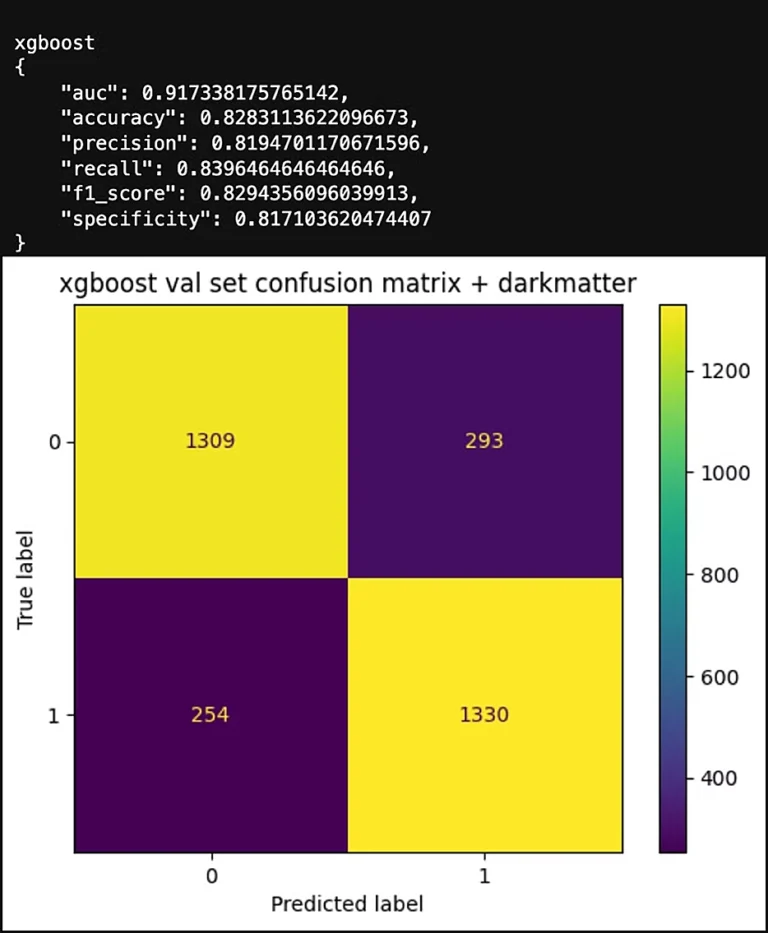
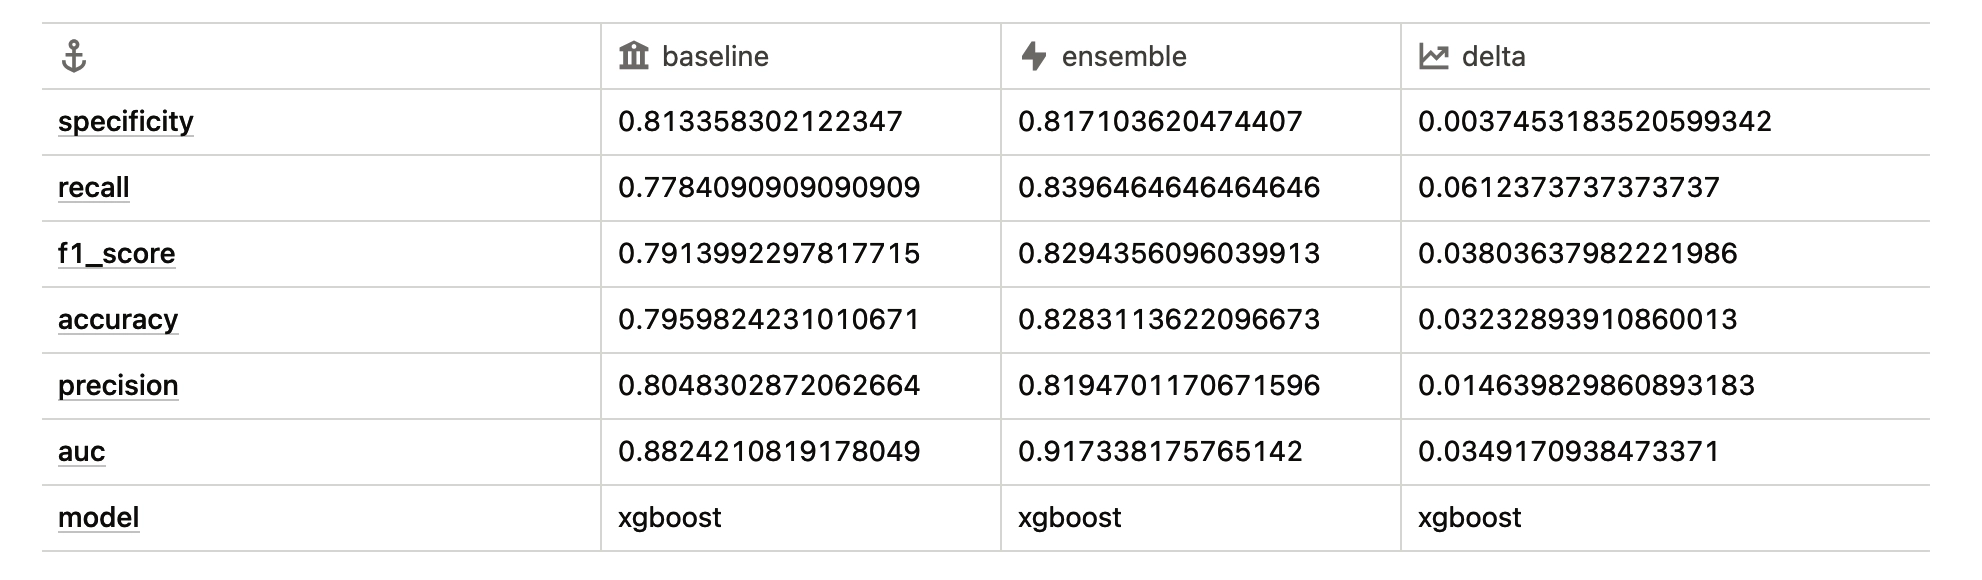
Metric Comparisons
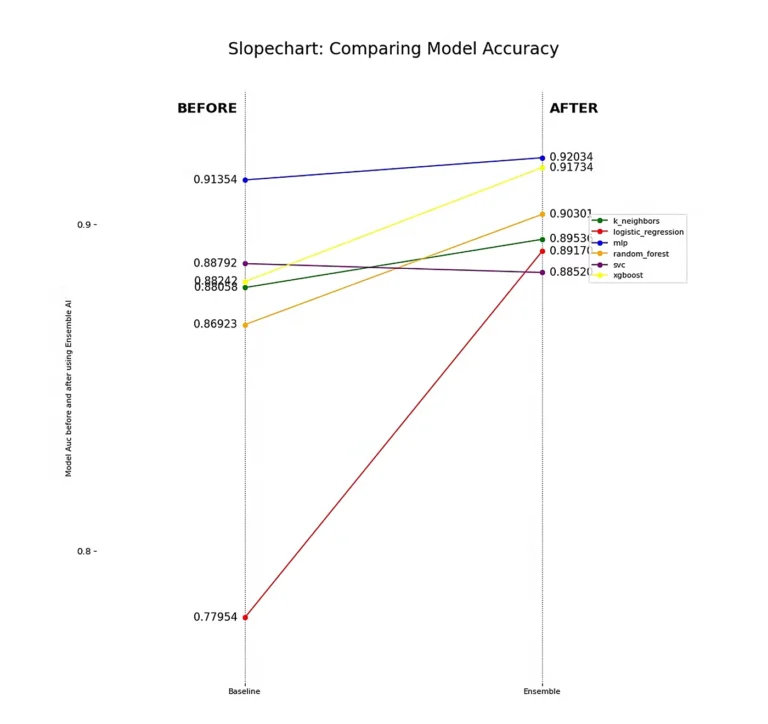
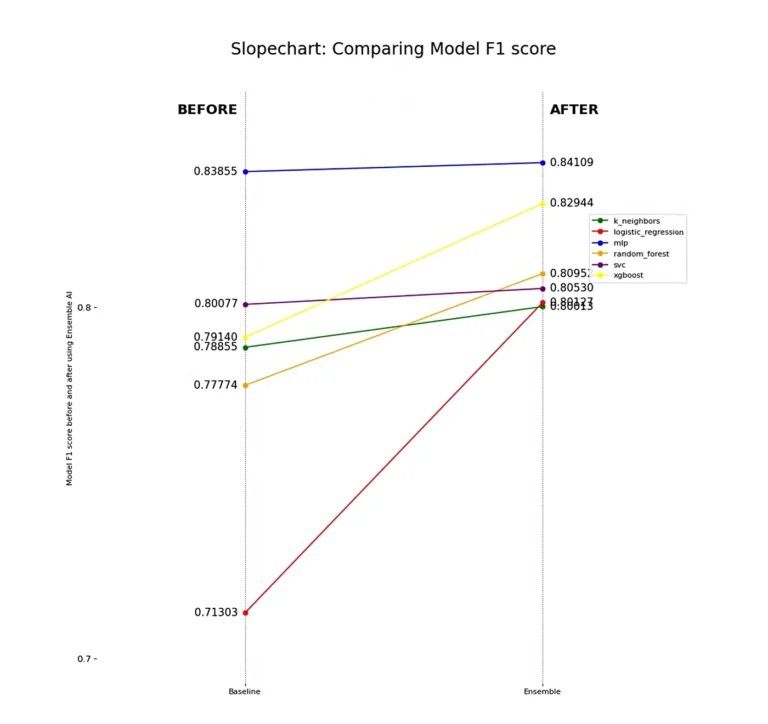
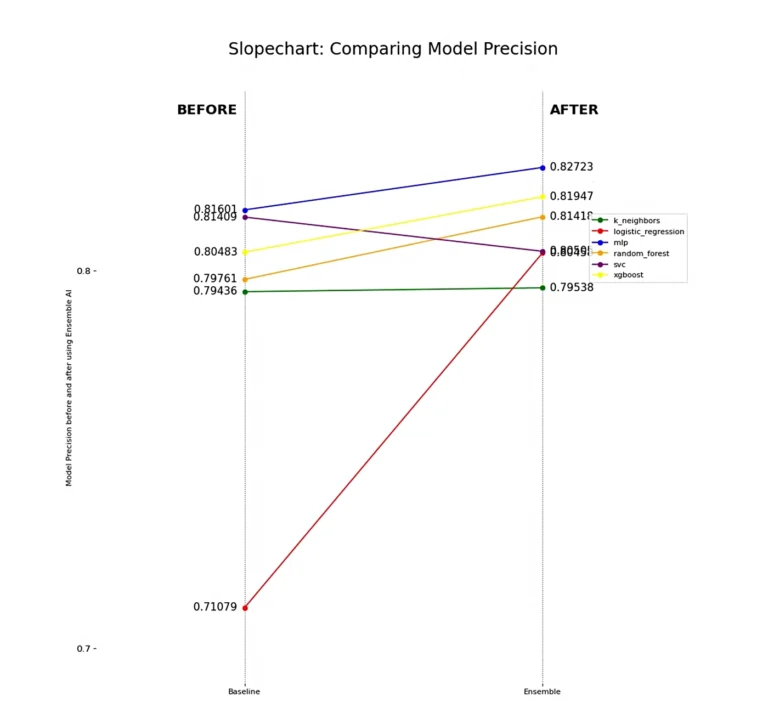
All models improve in their ability to find true positives (churning customers) while avoiding false positives, which we see when analyzing precision. The notable exception is the Support Vector Machine Classifier (SVC), which struggles to separate out some false positives. This highlights a limitation of using a linear model for this dataset, a finding corroborated by the Logistic Regression model.
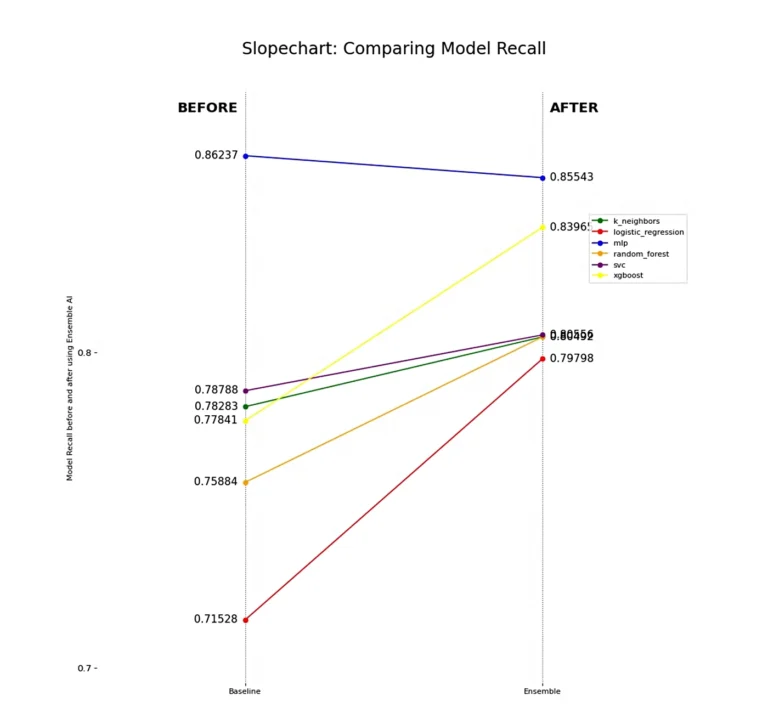
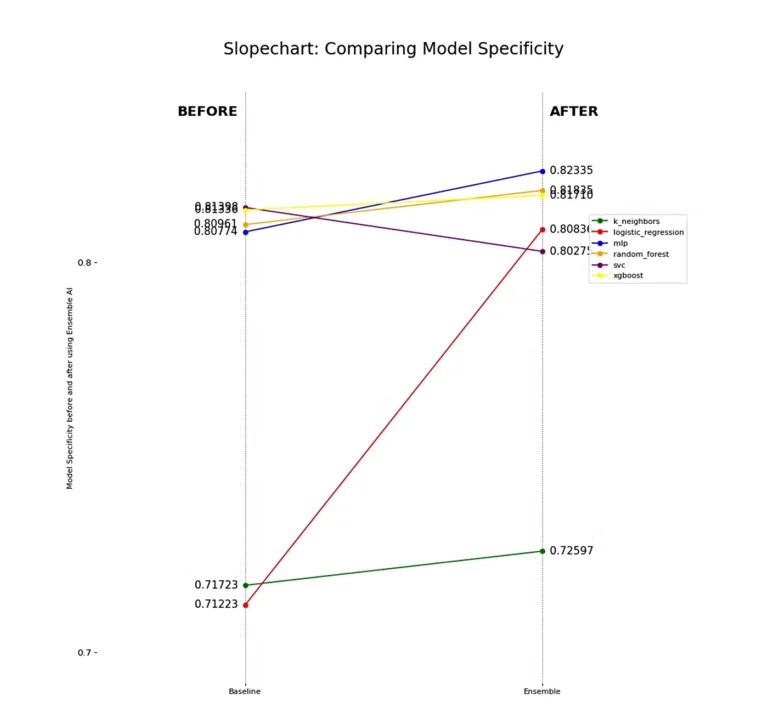
Each model experiences a boost in specificity, indicating an improved ability to classify the negative class, or non-churn customers. Notably, the MLP still shows overall improvement in non-churn classification despite the drop in recall we previously observed. This suggests that its non-churn predictions are more accurate, confirming our intuition from the F1 Score and Recall analysis—MLP achieves better separability between target classes when using Dark Matter compared to using the features directly.
However, we must highlight the drop in specificity for SVC, which further demonstrates that some linear models struggle with certain problem sets.
Lastly, it’s important to note that the K Neighbors Classifier (k_neighbors) has probably performed the weakest overall, which further highlights the complexity of finding separability between these two classes. Churn looks very similar to non-churn even with the features presented to us, yet Dark Matter is still able to detect and preserve hidden underlying patterns in the data that give linear and non-linear models alike better predictive power.
Conclusion
From a business perspective, we’ve achieved more accurate classifications for churn customers with reduced sensitivity to over-prediction. This improvement helps prevent unnecessary business decisions for customers not at risk of leaving.
Consider this scenario: if a customer is predicted to churn soon, the bank might offer them a special savings account at a loss. Misclassifying customers this way could cost the bank a huge amount of money annually in lost value, not to mention the cost of replacing them —a substantial expense that can significantly reduce revenue and margin. Conversely, failing to identify customers on the verge of churning results in lost annual revenue and may lead to lower customer satisfaction. Both cases in this example, impact the bank’s financial forecasting, making it challenging to make informed business decisions due to inaccurate data.